Working in a fast-growing company like Parcel Perform, we understood that we might have to sacrifice something for rapid feature development and stability. Optimal usage of hard resources was one of the sacrifices. For quite some time optimizing our scaling capabilities had taken a back seat as we opted for an easier approach, which was just scaling up resources so that we had enough to make it through a crunch. Our infrastructure had evolved ever since, and while lacking desired resources, we believed we made the right choice not to optimize from the start.
However, there was a time that we went for the optimization, and this article documents our journey on Cost Optimization, including the methodology and some tips and tricks to help readers who might be in the same shoes.
AWS and other Cloud providers allow you to provision thousands of CPUs and MEMs instances, and store terabytes of data at the snap of a finger*, sounds cool. But that comes at a cost - or rather the obscurity of it, sometimes hidden even from the explanation of the pricing documentation. Reaching a certain point, the complexity of the components and the infrastructure intertwined with the abstraction by the cloud provider, we ended up shooting ourselves in the collective foot.
We also have a relatively unique situation as we have large enough traffic to reach scaling problems. Some other startups can look away from scaling since they will have relatively linear growth. For us, that’s an instant bump. We encountered complex network calls, multi-az problems, storage size, monitoring issues, aws retaking instances… and other issues only transparent once you have been in bed with Cloud for too long.
We documented some key findings, costly components, and AWS services that we evaluated and enhanced to achieve the final expected target amount of running costs.
We spend money, and we save money
Considering the current application status and overall bandwidth traffic, we found that the price for infrastructure was relatively high compared to the traffic growth.
Based on the actual usage of each service spread over several months, the number of 40% raised is not linear with the traffic growth.
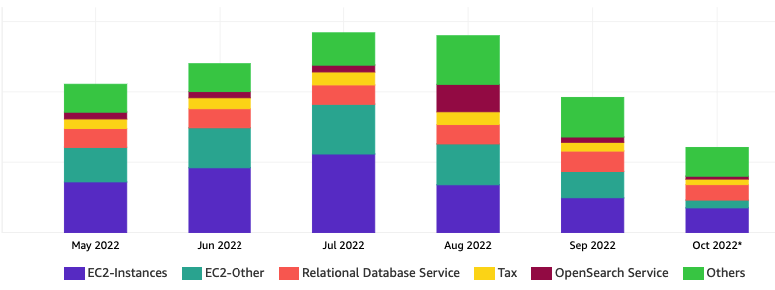
From the cost usage metrics, around July and August, we went from the usual number to a new peak we did not foresee (35% increase compared to just the last two months).
Such objective and subjective reasons embarked us to a journey of managing and optimizing the infrastructure, and as a result, reaping the results of saving money.
Findings Journey And Costly Monster - aka Identify the problems
We started by first going through past documents and resource usage patterns. After a while, we noticed something odd. We decided to isolate services to their own space* with different tags starting with the most computing-demanding services
We narrowed down three main culprits:
- Data Transfer ( LoadBalancers, Cross AZ traffic,… )
- NAT Gateway ( Cross AZ traffic,… )
- Resources ( Storage, EC2, Compute power,… )
These three accounted for a total of 50% of the infrastructure increase. And this was where we dug deeper.
Changes We Made & Things We Learned
Within this article, we would only mention several components and services that primarily affected cost saving. While there were still others, some additional implementation would be required before we could identify the exact benefits and saving capacity.
LoadBalancer & Data Transfer ~ 20% total cost reduction
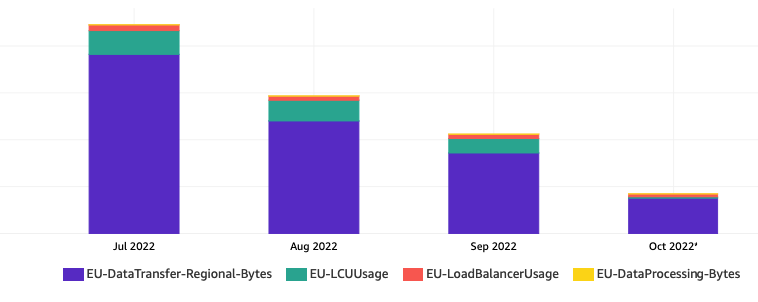
What we encounter:
It was clear that when you used EC2 services in a complex infrastructure, you would need components that help distribute requests and handle large amounts of data. In this case we used AWS Load Balancer (ELB/ALB).
We ran in two regions, one in Ireland (EU) and the other in Singapore (AP). We also ran on multiple AZ for the sake of High Availability. As one DataCenter goes down, we still have another to keep our system up. But the cost of doing so is that AWS charges for the cross-AZ cost (Ex: a request goes from one zone to another, from eu-west-1 to eu-west-2). At this point, AWS had charged us for both LoadBalancer itself and Cross-AZ.
What we do:
One component that significantly reduced the data transfer cost was migrating from self-host PgBouncer to RDS proxy. PgBouncer was there to enhance the read/write requests and the connection pool to databases. But PgBouncer cost us bandwidth money, while the bandwidth on RDS proxy was free. We quickly saw a sharp reduction in cost for LB and Data Transfer after the change.
Other components that might be using Load Balancers and cross-AZ bandwidth were more challenging to identify. We first moved each service’s NodeGroup from the inside of the private subnet out to the public subnet, measured and monitored for a few days, then moved another service nodegroup. We did them one by one to make sure we had a clear view of what happening.
Lessons Learn:
- Understand how EC2 is billed: especially the Data Transfer part, this will be extremely beneficial to you when designing and minimizing the unnecessary costs incurred.
- Service Connection: try to design and let your Service connect within the same Availability Zone (AZ), then the same Region as the conceptual thinking for every single service design.
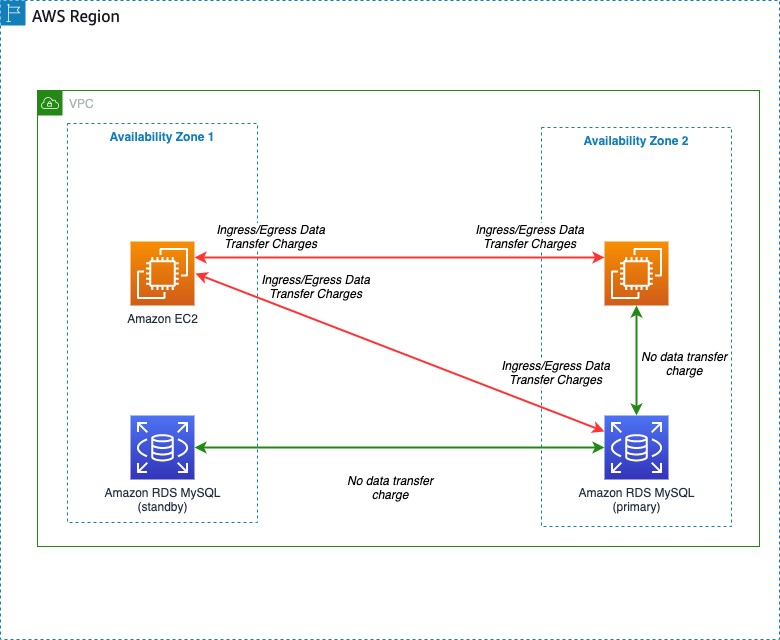
- Traffic amount: understand where your Service will call to, consider the methods and amount of traffic too.
- These cost will not bother you if you running small traffic application, but with large scale stream processing, it should be addressed.
NAT Gateway ~ 25% total cost reduction
What we encounter: One of the components where we eliminated almost all the cost was NAT Gateway. To do this, we had to redesign the infrastructure’s network architecture.
What we learned was that best practices only work in certain contexts (reference: https://aws.amazon.com/blogs/architecture/overview-of-data-transfer-costs-for-common-architectures/). We must adapt the best practice to the situation at hand while avoiding trying to go the other way around.
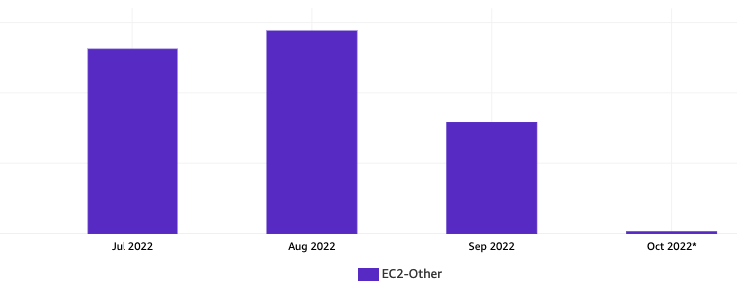
In AWS document, they mention we should put our system in Private Subnet, and all traffic goes through NAT Gateway, yet NAT Gateway is where AWS charges us big time.
What we do:
One example was Loki (a Logging Tool) that collected logs from every services and then funneled them into S3. There are two things we did that make the most impact:
- Moves Loki into Public Subnet (with the security consideration and restriction applied to avoid unauthorized access)
- Uses S3 Endpoint
We picked loki for its characteristics:
- Multiple AZ ( loki need to be available on almost every node to collect logs )
- A central service that collector will send data to ( large inbound/outbound traffic )
With Loki moved to Public Subnet, we confirmed our assumption about how AWS calculated traffic cost and started to think about other services we were using. We wouldn’t go into the details in this article but in short, services benefited from this move tended to have large cluster, spread across multiple AZs, and offer APIs used by multiple others.
S3 Endpoint also reduces the cost when the application spreads across multiple AZ/Region, and our logging/monitoring system fitted this perfectly (as if AWS knows this is a common case and goes as far as creating a service for it).
After moving Loki to outside and letting the logs flowing through Load Balancer only, NAT Gateway traffic reduced more than 90%.
Lessons Learn:
- Although it’s recommended for to use private subnet for as many resources as possible (e.g Database, critical business applications, etc.), there is a charge on both data transfer and NAT Gateway.
- For service internal calls through the other AZ or Region, the charge will even higher (example: Logging Service mentioned above)
- S3: When you work with S3 from EC2 service, try to use S3 Endpoints if the systems or services are from a group of instances across the AZ/Region. This will reduce charge from being calls to S3 (putting objects files) via NAT Gateway too
Resources Allocation & Autoscaling ~ 50% total cost reduction
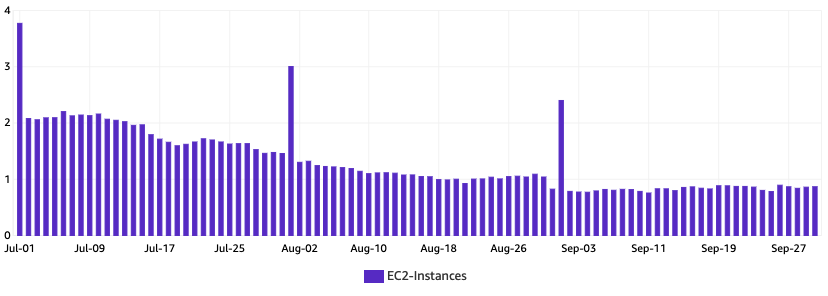
Our findings in other parts of the system led us to one last suspect, the resource allocation. This was also where we managed to save the mos. Along with the data transfer and network re-architect, we also took a closer look into how our system operated and the services' status.
We came up with two main ideas:
- Optimizing Application Resources
- Resources Autoscaling Capability
We initiated by adjusting to the resource definition (CPU/Memory) for high-traffic components. Leveraging the usage data captured from our monitoring system along with discussing with other squads, we determined the new resource range (Request & Limit Caps). Resources Adjustment is non-trivial since we have to balance between stability, availability, and cost; over-requested, we would pay for what we do not use; lack of resources, our system would suffer from throttling. And, of course, in optimizing for cost, although carefully planning and monitoring, we still unintentionally caused some hiccups here and there.
Continuing the resources definition, we then had a baseline to that we could apply autoscaling. Auto-scaling gave us the ability to scale up and down to match the peak in traffic and to handle unusual situations when there were bottlenecks that needed to be solved. But autoscaling could be a double-edged sword. Too sensitive of a trigger will cause the application to fluctuate, potentially dropping requests in the process of spinning up and down. For example, load going into Public API can be Spiky with a peak around 4 PM. These patterns would be taken into consideration when we applied autoscaling.
Lessons Learn:
- In Kubernetes, the “request” amount defines the minimal system resources allocated to that container while the “limit” enforces the maximum resources the running container is allowed to use. Most of the services set the Request amount higher than what is needed, and the cluster had to expand in order to have enough reserved amount of resources. This increment also affected the number of EC2 instances. In the sample below, CPU limit is 1 core, requests 0.5, and barely uses it.

- Always try to consider request input and load needed for your service (by input traffic, basic load testing, using similar service knowledge from others, etc.)
- Autoscaling relies on the trigger metric(s), which will be used as a threshold of scaling behavior. It’s good to answer the question “does the service be autoscaled?” and “what is the best trigger for scaling?” when you design the new service
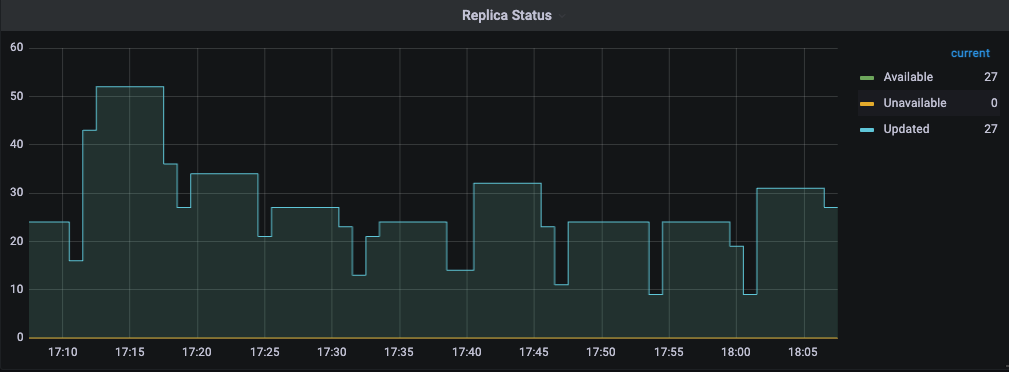
- Setting the Limit is crucial, because the service will be restart when the limit is reached, so if you set too low, your service might have issue of restarting too much, but if you set this too high, possible the node will be overused when multiple services using too much at the same time (remember, your service restart impact only that service, but node die will impact multiple services, so choose wisely)

Things we couldn’t do yet
In the process of learning and improving as mentioned above, there are some problems that have been identified and optimal solutions are also recommended yet we haven’t got the time to get to them.
Kubernetes Topology Aware Hints
This feature enables topology aware routing by including suggestions for how clients should consume endpoints so that traffic to those network endpoints can be routed closer to where it originated. In short this will help our service calling to the target service preferred to the same Zone, and we can save data transfer traffic costs. Our current infrastructure are not running on version of kernel that support this feature (v1.24 cluster which we have plan to upgrade in near future)
Amazon MSK consumers with rack awareness
Our current Kafka processing with multiple replication factor messages will always point back to the leader, that means the Data Transfer costs will occur if the consumers are located in different AZ with the leader. Before closest replica fetching was allowed, all consumer traffic went to the leader of a partition, which could be in a different rack, or Availability Zone, than the client consuming data. But with capability from KIP-392 starting in Apache Kafka 2.4, we can configure our Kafka consumers to read from the closest replica brokers rather than the partition leader.
Conclusion
Throughout the entire process of this cost optimization epic, we have analyzed the usage cost of each service, reviewed changes from the past and the reason, as well as investigated each suspected service cost. A number of lessons and solutions have been identified, and they significantly improved the usage and deployment as well as optimization for each operating service. There are also some limitations in terms of infrastructure support, applicable resources and tools, and human effort that needs to be invested in completing. However, the results achieved up to the time of writing this article are also a worthy reward for the efforts of the untiring contribution and support from not only Heimdall, but also fantastic development teams in Parcel Perform.
Reference
- https://aws.amazon.com/blogs/apn/aws-data-transfer-charges-for-server-and-serverless-architectures/
- https://aws.amazon.com/ec2/pricing/on-demand/
- https://aws.amazon.com/blogs/architecture/overview-of-data-transfer-costs-for-common-architectures/
- https://keda.sh/
- https://kubernetes.io/docs/concepts/configuration/manage-resources-containers/
- https://www.cloudforecast.io/blog/aws-nat-gateway-pricing-and-cost/
- https://kubernetes.io/docs/concepts/services-networking/topology-aware-hints/
- https://aws.amazon.com/blogs/big-data/reduce-network-traffic-costs-of-your-amazon-msk-consumers-with-rack-awareness/
- https://cwiki.apache.org/confluence/display/KAFKA/KIP-392%3A+Allow+consumers+to+fetch+from+closest+replica
